994 字
5 分钟
利用UptimeFlare搭建状态面板
教程前置
- Cloudflare 账号
- Github 账号
- lyc8503/UptimeFlare仓库(先别急着Fork)
✔ Cloudflare Workers 上的免费无服务器正常运行时间监控/状态页面,具有特定于地理位置的检查
提醒 color:cyan
由于使用了 Workers 来提供运行检查,所以请求数将会有较大的增加。
开始
1.申请 用于编辑Workers 的Key
如果先前有创建,可以使用。
在此处申请用于构建的api令牌

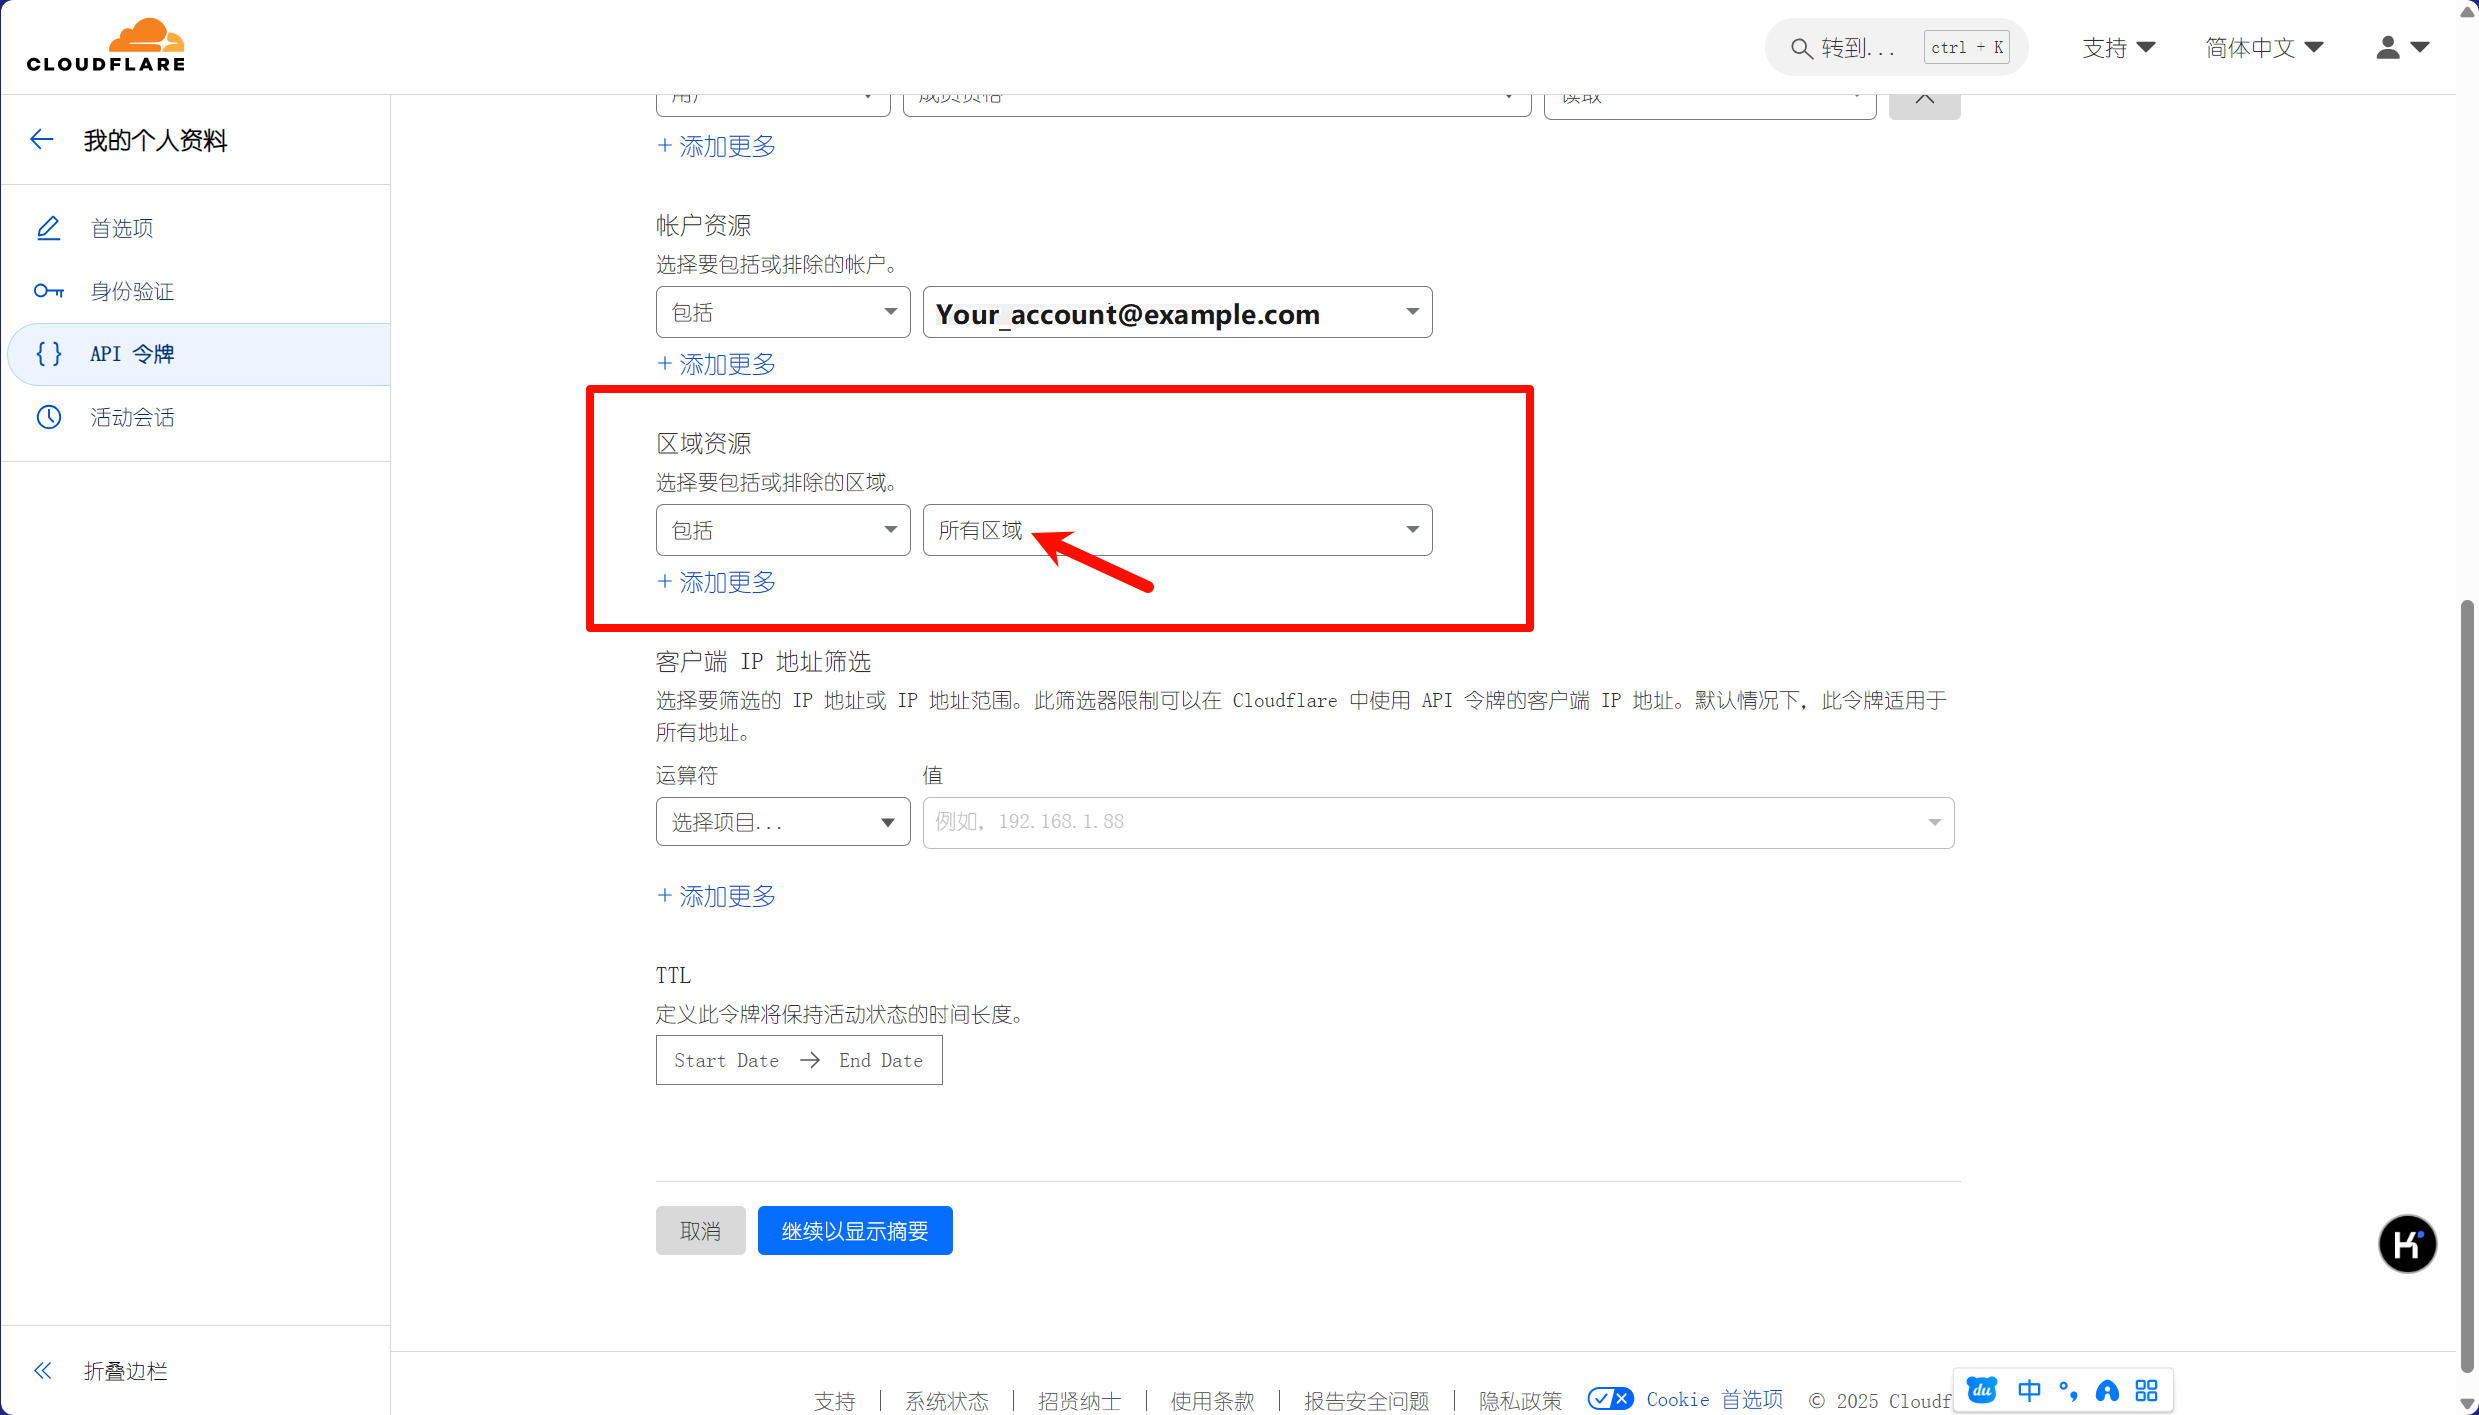
接着下一步,会显示出创建出的api,复制保存。
2.使用该仓库模板
需要设置为私有,防止api泄露
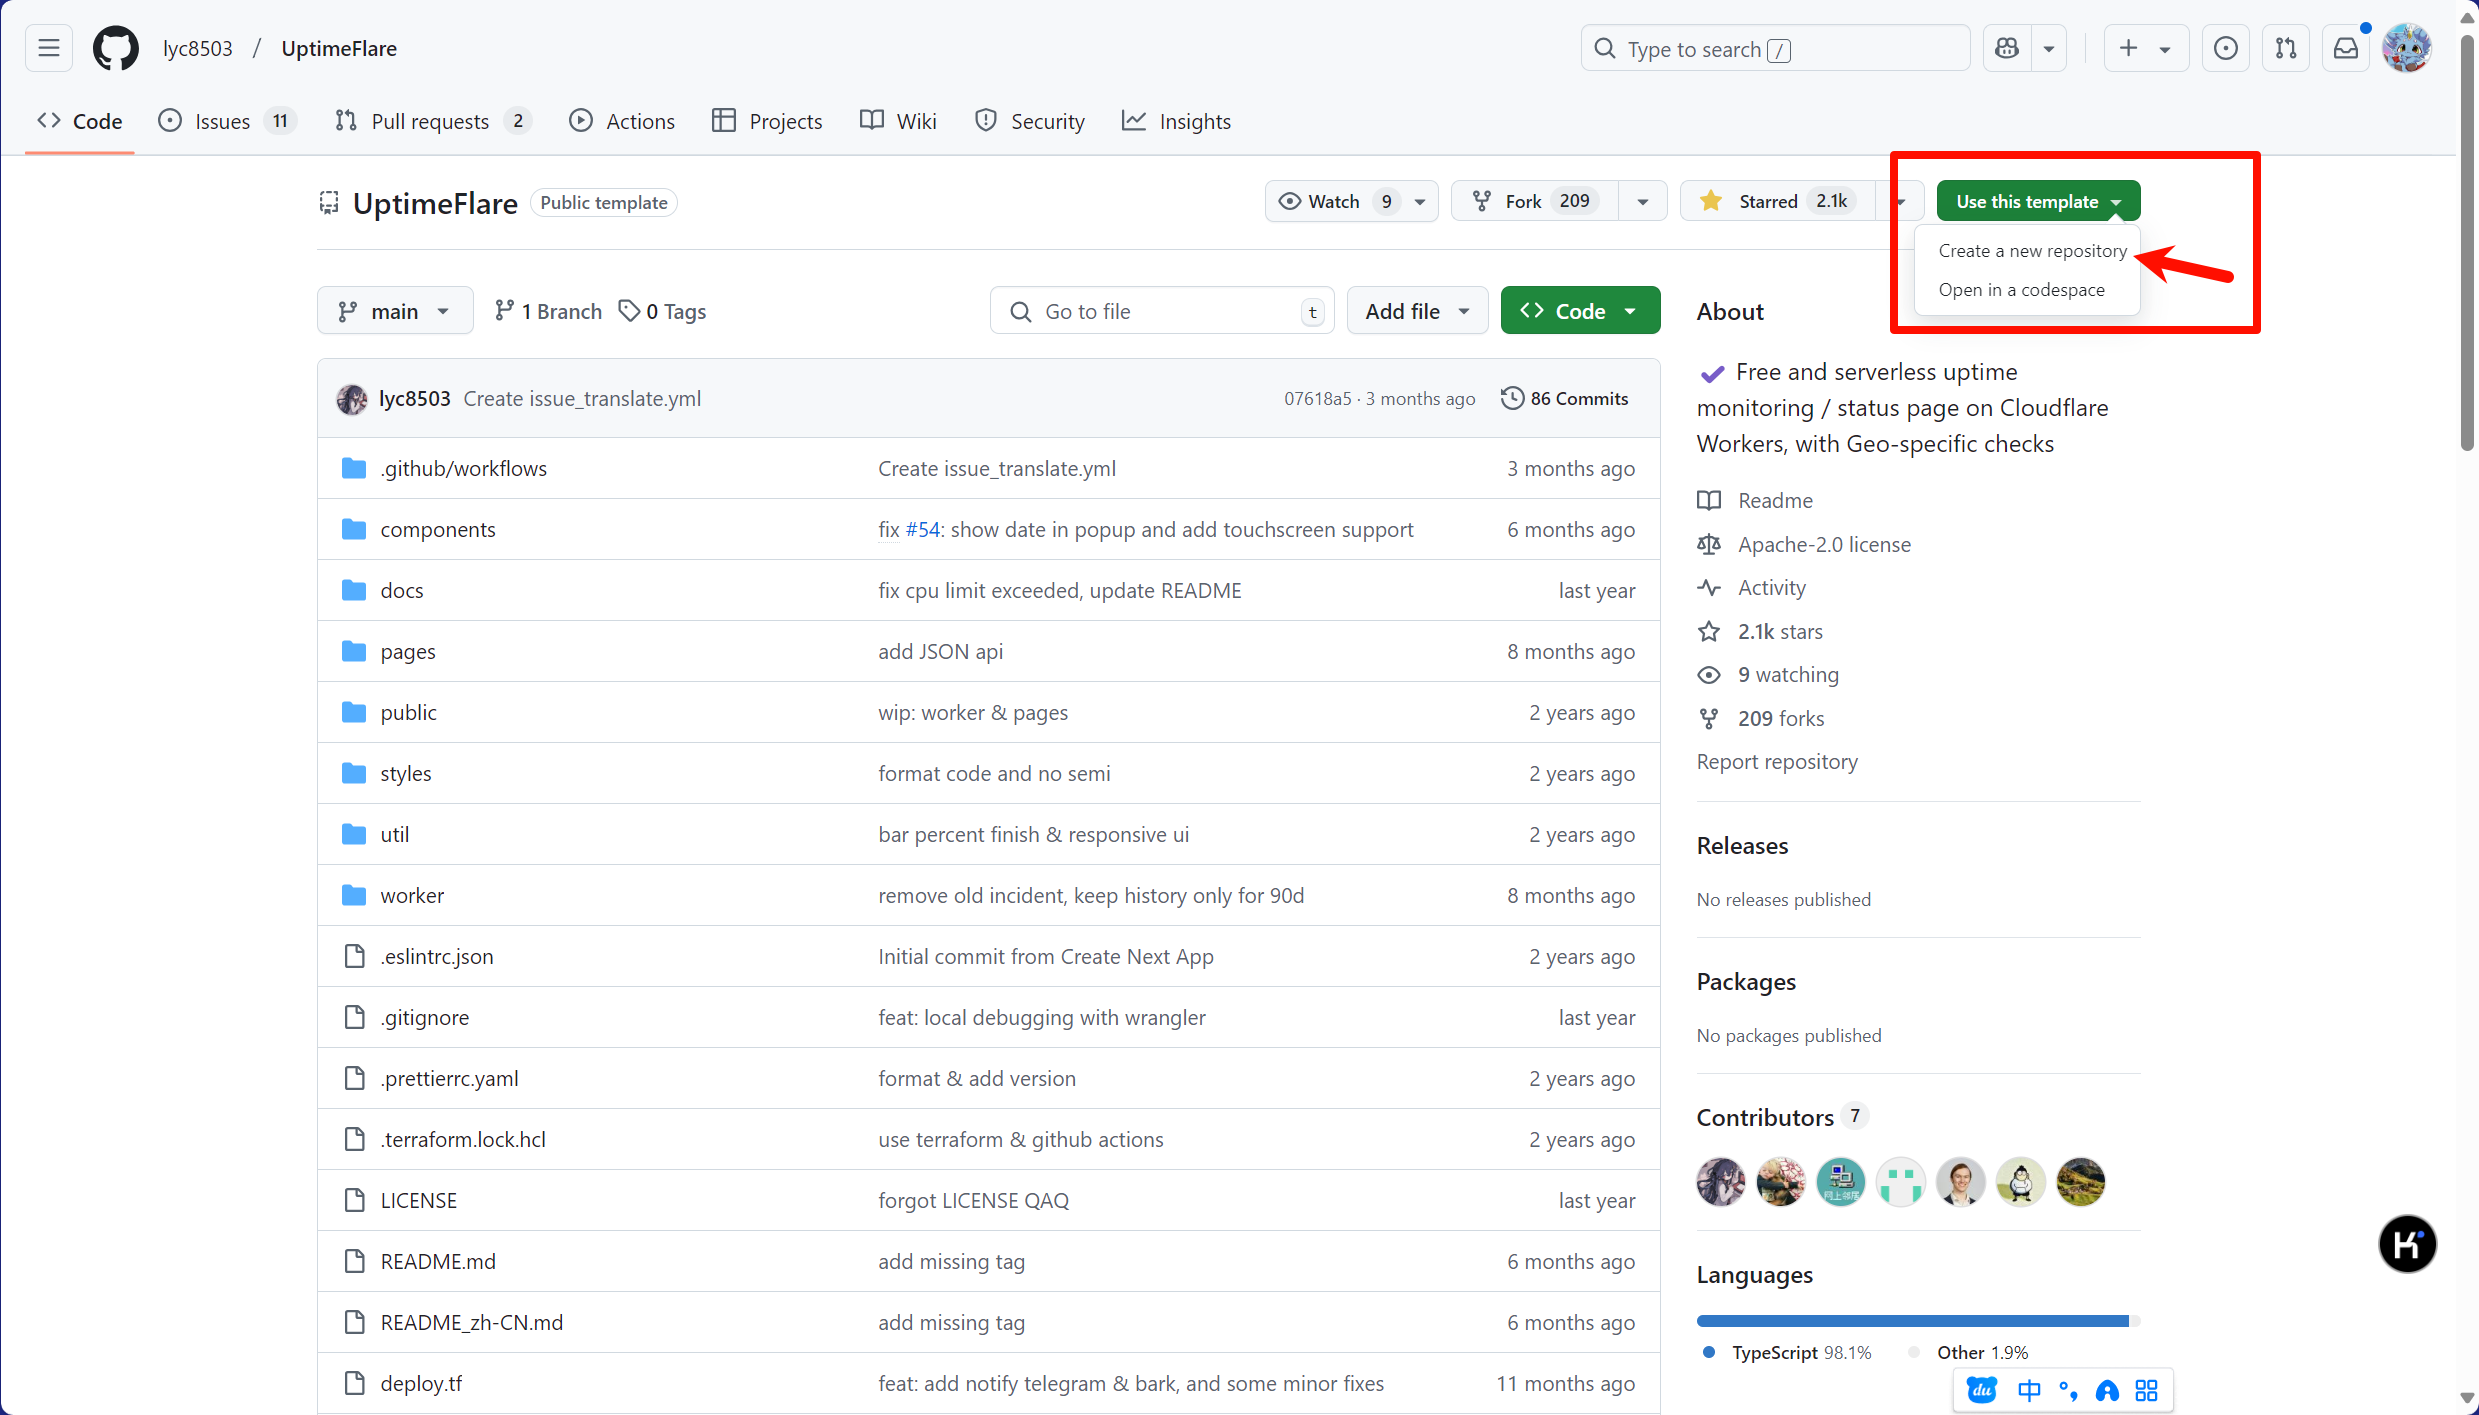
新建好仓库后,在Settings - Secrets and variables - Actions处新建一个密钥,名字为CLOUDFLARE_API_TOKEN,将刚才保存的api放进去即可。
配置
打开文件uptime.config.ts
页面配置
const pageConfig = { title: "lyc8503's Status Page", links: [ { link: 'https://github.com/lyc8503', label: 'GitHub' }, { link: 'https://blog.lyc8503.site/', label: 'Blog' }, { link: 'mailto:me@lyc8503.site', label: 'Email Me', highlight: true }, ],}| 项目 | 说明 |
|---|---|
title | 网站标题 |
links | 顶部外部链接 |
根据 json 严格的语法规则,应该要严格地按照上方格式来填写。
补充 color:cyan
对于 json 排版可以有两种:
{ link: '...', label: '...'},{ link: '...', label: '...'}亦或者是
{link: '...',label: '...'},{link: '...',label: '...'}并且单引号和双引号都可以被识别
监控配置
const workerConfig = { kvWriteCooldownMinutes: 3, passwordProtection: 'username:password', monitors: [ { id: 'foo_monitor', name: 'My API Monitor', method: 'GET', target: 'https://www.google.com' }, { id: 'test_tcp_monitor', name: 'Example TCP Monitor', method: 'TCP_PING', target: '1.2.3.4:22' }, // You can continue to define more monitors here... ], notification: { //... }, callbacks: { //... },}监控配置(monitors)
监控的配置在 monitors 中配置,如上文,按照 json 语法进行编写。
单个监控的完整配置如下文
{ id: 'foo_monitor', // `name` is used at status page and callback message name: 'My API Monitor', // `method` should be a valid HTTP Method or "TCP_PING" for TCP port monitor method: 'POST', // `target` is a valid URL for HTTP or hostname:port for TCP target: 'https://example.com', // [OPTIONAL] `tooltip` is ONLY used at status page to show a tooltip tooltip: 'This is a tooltip for this monitor', // [OPTIONAL] `statusPageLink` is ONLY used for clickable link at status page statusPageLink: 'https://example.com', // [OPTIONAL] `expectedCodes` is an array of acceptable HTTP response codes, if not specified, default to 2xx expectedCodes: [200], // [OPTIONAL] `timeout` in millisecond, if not specified, default to 10000 timeout: 10000, // [OPTIONAL] headers to be sent with HTTP monitor headers: { 'User-Agent': 'Uptimeflare', Authorization: 'Bearer YOUR_TOKEN_HERE', }, // [OPTIONAL] body to be sent with HTTP monitor body: 'Hello, world!', // [OPTIONAL] if specified, the HTTP response must contains the keyword to be considered as operational. responseKeyword: 'success', // [OPTIONAL] if specified, the check will run in your specified region, // refer to docs https://github.com/lyc8503/UptimeFlare/wiki/Geo-specific-checks-setup before setting this value checkLocationWorkerRoute: 'https://xxx.example.com',},项目(带*为必选) | 说明 |
|---|---|
*id | id应该是唯一的,如果id保持不变,历史记录将被保留(有大用!) |
*name | name用于状态页面和回调消息 |
*method | method应该是TCP端口监视器的有效HTTP方法(例如GET)或TCP_PING。 |
*target | HTTP的有效URL或TCP的hostname |
tooltip | 用于状态页面显示工具提示 |
statusPageLink | 用于状态页面上的可点击链接 |
expectedCodes | 一个可接受的HTTP响应代码数组,如果未指定,默认为2xx |
timeout | 超时时间 |
headers | 与HTTP监视器一起发送的标头 |
body | 将与HTTP监视器一起发送 |
responseKeyword | 如果指定,HTTP响应必须包含被视为可操作的关键字 |
checkLocationWorkerRoute | 如果指定,检查将在您指定的区域运行 |
当然,这边建议只需要写必选即可,其他不写。
通知配置(notification)
这个要用到Tg,因此我就不写了,具体看文档。
Callbacks
默认即可,无需理会
部署
等待Github Action自动部署即可,建议绑定一个自己的域名
拓展
嵌入为 iframe
在部署页面后,链接末尾加#id即可
效果:

JSON格式数据
链接后加/api/data即可
{ "up": 6, // There're currently 6 up monitors... "down": 1, // ...and 1 down monitors "updatedAt": 1719764731, // Last updated timestamp "monitors": { "www": { // Key is `id` in config "up": true, // Current status (boolean) "latency": 65, // Latency at last monitor "location": "SIN", // Datacenter used at last monitor "message": "OK" // Description of current status (Error message in case of DOWN) }, "homelab": { "up": false, "latency": 1896, "location": "SJC", "message": "HTTP response doesn't contain the configured keyword" }, //...... }} 利用UptimeFlare搭建状态面板
https://fuwari.vercel.app/posts/18523/ 评论
本站由 绮曜 使用 Furrity 主题(略微由我更改)创建。
本博客所有文章除特别声明外,均采用 CC BY-NC-SA 4.0 许可协议,转载请注明出处。
Copyright © since 2024-2025 绮曜
感谢访问我的网站
载入天数... 载入时分秒...